Author: Dr. Jean-Paul Rodrigue
Accessibility is a key element in transport geography and geography in general since it is a direct expression of mobility either in terms of people, freight, or information.
1. Defining Accessibility
Mobility is a choice made by users and is, therefore, a way to evaluate the impacts of infrastructure investment and related transport policies on regional development. Well-developed and efficient transportation systems offer high accessibility levels, while less-developed ones have lower levels of accessibility. Thus, accessibility is linked with an array of economic and social opportunities, but congestion can also have a negative impact on mobility.
Accessibility is the measure of the capacity of a location to be reached from, or to be reached by, different locations. Therefore, the capacity and the arrangement of transport infrastructure are key elements in the determination of accessibility.
All locations are not equal because some are more accessible than others, which implies inequalities. Thus, accessibility is a proxy for spatial inequalities and remains fundamental since only a small subset of an area is the most accessible. The notion of accessibility relies on two core concepts:
- The first is location, where the relativity of space is estimated in relation to transport infrastructures since they offer the means to support mobility. Each location has a set of referential attributes, such as its population or level of economic activity.
- The second is distance, which is derived from the physical separation between locations. Distance can only exist when there is a possibility to link two locations through transportation. It expresses the friction of distance, and the location with the least friction relative to others is likely to be the most accessible. The friction of distance is commonly expressed in units such as in kilometers or in time, but variables such as cost or energy spent can also be used.
There are two spatial categories applicable to accessibility problems, which are interdependent:
- The first type is topological accessibility, which is related to measuring accessibility in a system of nodes and paths (a transportation network). It is assumed that accessibility is a measurable attribute significant only to specific elements of a transportation system, such as terminals (airports, ports, or subway stations).
- The second type is contiguous accessibility, which involves measuring accessibility over a surface. Under such conditions, accessibility is a cumulative measure of the attributes of every location over a predefined distance, as space is considered contiguous. It is also referred to as isochrone accessibility.
Last, accessibility is a good indicator of the underlying spatial structure since it takes into consideration location as well as the inequality conferred by distance to other locations.


2. Connectivity and Total Accessibility
The most basic accessibility measure involves network connectivity, where a network is represented as a connectivity matrix (C1), which expresses the connectivity of each node with its adjacent nodes. The number of columns and rows in this matrix is equal to the number of nodes in the network, and a value of 1 is given for each cell where this is a connected pair and a value of 0 for each cell where there is an unconnected pair. Simple networks and their connectivity matrices are rare. Thus, the matrix becomes exponentially more complex with the number of nodes. The summation of this matrix provides a very basic measure of accessibility, also known as the degree of a node:

- C1 = degree of a node.
- Cij = connectivity between node i and node j (either 1 or 0).
- n = number of nodes.
The connectivity matrix does not consider all the possible indirect paths between nodes. Under such circumstances, two nodes could have the same degree but may have different accessibilities. To consider this attribute, the Total accessibility matrix (T) is used to calculate the total number of paths in a network, including direct and indirect paths. Its calculation involves the following steps:


- D = the diameter of the network.
Thus, total accessibility would be a more comprehensive accessibility measure than network connectivity.


 | The Geography of Transport Systems")
3. The Shimbel Index and the Valued Graph
The main focus of measuring accessibility does not necessarily involve measuring the total number of paths between locations but rather the shortest paths between them. Even if several paths between two locations exist, the shortest one is likely to be selected. In congested networks, the shortest path may change according to the current traffic level in each segment. Consequently, the Shimbel index calculates the minimum number of paths necessary to connect one node with all the nodes in a defined network. The Shimbel accessibility matrix, also known as the D-Matrix, includes each possible node pair with the shortest path.
The Shimbel index and its D-Matrix fail to consider that a topological link between two nodes may involve variable distances. Thus, it can be expanded to include the notion of distance, where value is attributed to each link in the network. The valued graph matrix, or L-Matrix, represents such an attempt. It is very similar to the Shimbel accessibility matrix. The only difference is that instead of showing the minimal path in each cell, it provides a minimal distance between each node of the network.
 | The Geography of Transport Systems")
4. Geographic and Potential Accessibility
From the accessibility measure developed so far, it is possible to derive two simple and highly practical measures, defined as geographic and potential accessibility. Geographic accessibility considers that the accessibility of a location is the summation of all distances between other locations divided by the number of locations. The lower its value, the more accessible a location is.


- A(G) = geographical accessibility matrix.
- dij = shortest path distance between location i and j.
- n = number of locations.
- L = valued graph matrix.
This measure (A(G)) is an adaptation of the Shimbel Index and the Valued Graph, where the most accessible place has the lowest summation of distances. Locations can be nodes in a network or cells in a spatial matrix.
Potential accessibility is a more complex measure than geographic accessibility since it simultaneously includes the concept of distance weighted by the attributes of a location. All locations are not equal, and thus, some are more important than others. Potential accessibility can be measured as follows:
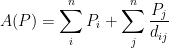
- A(P) = potential accessibility matrix.
- dij = friction of distance between place i and j (derived from valued graph matrix).
- Pj = attributes of place j, such as population, retailing surface, parking space, etc.
- n = number of locations.
The potential accessibility matrix is not transposable since locations do not have the same attributes, which brings the underlying notions of emissiveness and attractiveness:
- Emissiveness is the capacity to leave a location, the sum of the values of a row in the A(P) matrix.
- Attractiveness is the capacity to reach a location, the sum of the values of a column in the A(P) matrix.


Although accessibility can be solved using a spreadsheet (or manually for simpler problems), Geographic Information Systems have proven to be a very useful and flexible tool to measure accessibility, notably over a surface simplified as a matrix (raster representation). This can be done by generating a distance grid for each place and then summing all the grids to form the total summation of distances (Shimbel) grid. The cell having the lowest value is thus the most accessible location.
Related Topics
- 1.2 – Transportation and Space
- 2.2 – Transport and Spatial Organization
- 2.3 – Transport and Location
- A.2 – Geographic Information Systems for Transportation (GIS-T)
- A.18 – Spatial Interactions and the Gravity Model
Bibliography
- BTS (2001) Special Issue on Methodological Issues in Accessibility, Journal of Transportation and Statistics, Vol. 4, No. 2/3, Bureau of Transportation Statistics, Sept/Dec.
- Burns, L.D. (1979) Transportation, Temporal, and Spatial Components of Accessibility. Lexington, MA: Lexington Books.
- El-Geneidy, A.M., and D.M. Levinson (2006) Access to Destinations: Development of Accessibility Measures. Retrieved from the University of Minnesota Digital Conservancy, https://hdl.handle.net/11299/638.