Author: Dr. Jean-Paul Rodrigue
The Gini coefficient measures the degree of concentration (inequality) of a variable in a distribution of its elements.
1. The Lorenz Curve
The Gini coefficient compares the Lorenz curve of a ranked empirical distribution with the line of perfect equality. This line assumes that each observation has the same contribution to the total summation of the values of all the observations. The Gini coefficient ranges between 0, where there is no concentration (perfect equality), and 1 where there is total concentration (perfect inequality).
The Gini coefficient can be used in numerous instances, such as assessing income distribution among a set of contiguous regions (or countries) or to measure other spatial phenomena, such as industrial location. Its major purpose as a method in transport geography has been measuring traffic concentration, mainly at terminals, such as assessing changes in port system concentration. Economies of scale in transportation can favor traffic concentration at transport terminals such as ports and airports. At the same time, other considerations, such as accessibility to regional markets, can be perceived as a countervailing force to concentration. So, the temporal variations of the Gini coefficient reflect changes in the comparative advantages of a location within the transport system.
Three different measures of inequality linked to the Gini Coefficient are presented below. They are all linked to the concept of comparing the Lorenz curve with the lines of perfect equality and inequality.


2. Index of Dissimilarity (ID)
The dissimilarity index is the summation of vertical deviations between the Lorenz curve and the line of perfect equality, also known as the summation of Lorenz’s differences. The closer the ID is to 1 (or 100 if percentages are used instead of fractions), the more dissimilar the distribution is to the line of perfect equality.

Where X and Y are percentages (or fractions) of the total number of observations and their respective values (traffic being the most common). N is the number of observations. For instance, the following considers the distribution of traffic among 5 terminals:
| Terminal | Traffic | X | Y | |X-Y| |
|---|---|---|---|---|
| A | 25,000 | 0.2 | 0.438 | 0.238 |
| B | 18,000 | 0.2 | 0.316 | 0.116 |
| C | 9,000 | 0.2 | 0.158 | 0.042 |
| D | 3,000 | 0.2 | 0.053 | 0.147 |
| E | 2,000 | 0.2 | 0.035 | 0.165 |
| Total | 57,000 | 1.0 | 1.0 | 0.708 |
Terminal B, with traffic of 18,000, accounts for 0.2 (or 20%; X) of all terminals and 0.316 (or 31.6%; Y) of all traffic. The dissimilarity index of this distribution is 0.354 (0.708 * 0.5), which indicates an average concentration level. A more complex example is provided here.

3. Gini’s Coefficient (G)
The Gini Coefficient represents the area of concentration between the Lorenz curve and the line of perfect equality. It expresses a proportion of the area enclosed by the triangle defined by the line of perfect equality and the line of perfect inequality. The closer the coefficient is to 1, the more unequal the distribution.
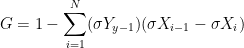
Where σX and σY are cumulative percentages of Xs and Ys (in fractions), and N is the number of elements (observations). Using the same example as above, the following table demonstrates the calculation of the Gini coefficient:
| Terminal | Traffic | X | Y | σX | σY | σXi-1 – σXi (B) | σYi-1 + σYi (A) | A*B |
|---|---|---|---|---|---|---|---|---|
| A | 25,000 | 0.2 | 0.438 | 0.2 | 0.438 | 0.2 | 0.438 | 0.088 |
| B | 18,000 | 0.2 | 0.316 | 0.4 | 0.754 | 0.2 | 1.192 | 0.238 |
| C | 9,000 | 0.2 | 0.158 | 0.6 | 0.912 | 0.2 | 1.666 | 0.333 |
| D | 3,000 | 0.2 | 0.053 | 0.8 | 0.965 | 0.2 | 1.877 | 0.375 |
| E | 2,000 | 0.2 | 0.035 | 1.0 | 1.000 | 0.2 | 1.965 | 0.393 |
| Total | 57,000 | 1.0 | 1.000 | 1.427 |
The Gini coefficient for this distribution is 0.427 (|1-1.427|). A more complex example is provided here.

Related Topics
- Transport and Location
- Port Terminals
- Airport Terminals
- The Specialization Index and the Location Coefficient
Bibliography
- Duncan, O.D and B. Duncan (1995) “A methodological analysis of segregation indexes”, American Sociological Review. Vol. 20, pp. 210-17.
- Kuby, M. and N. Reid (1992) “Technological change and the concentration of the U.S. general cargo ports system: 1970-88”, Economic Geography, 68(3), pp. 272-288.